> ## Documentation Index
> Fetch the complete documentation index at: https://langchain-5e9cc07a-preview-update-1770920925-e15dbde.mintlify.site/llms.txt
> Use this file to discover all available pages before exploring further.
# Alerts in LangSmith
**Self-hosted Version Requirement**
Access to alerts requires Helm chart version **0.10.3** or later.
## Overview
Effective observability in LLM applications requires proactive detection of failures, performance degradations, and regressions. LangSmith's alerts feature helps identify critical issues such as:
* API rate limit violations from model providers
* Latency increases for your application
* Application changes that affect feedback scores reflecting end-user experience
Alerts in LangSmith are project-scoped, requiring separate configuration for each monitored project.
## Configuring an alert
### Step 1: Navigate to create alert
First navigate to the Tracing project that you would like to configure alerts for. Click the Alerts icon on the top right hand corner of the page to view existing alerts for that project and set up a new alert.
### Step 2: Select metric type
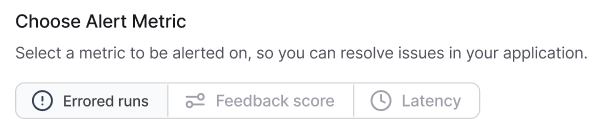
LangSmith offers threshold-based alerting on three core metrics:
| Metric Type | Description | Use Case |
| ------------------ | ----------------------------------- | -------------------------------------------------------------------------------------------------------------------------------------------------------------------- |
| **Errored Runs** | Track runs with an error status | Monitors for failures in an application. |
| **Feedback Score** | Measures the average feedback score | Track [feedback from end users](/langsmith/attach-user-feedback) or [online evaluation results](/langsmith/online-evaluations-llm-as-judge) to alert on regressions. |
| **Latency** | Measures average run execution time | Tracks the latency of your application to alert on spikes and performance bottlenecks. |
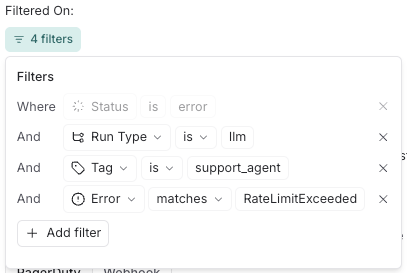
Additionally, for **Errored Runs** and **Run Latency**, you can define filters to narrow down the runs that trigger alerts. For example, you might create an error alert filter for all `llm` runs tagged with `support_agent` that encounter a `RateLimitExceeded` error.
### Step 2: Define alert conditions
Alert conditions consist of several components:
* **Aggregation Method**: Average, Percentage, or Count
* **Comparison Operator**: `>=`, `<=`, or exceeds threshold
* **Threshold Value**: Numerical value triggering the alert
* **Aggregation Window**: Time period for metric calculation (currently choose between 5 or 15 minutes)
* **Feedback Key** (Feedback Score alerts only): Specific feedback metric to monitor
**Example:** The configuration shown above would generate an alert when more than 5% of runs within the past 5 minutes result in errors.
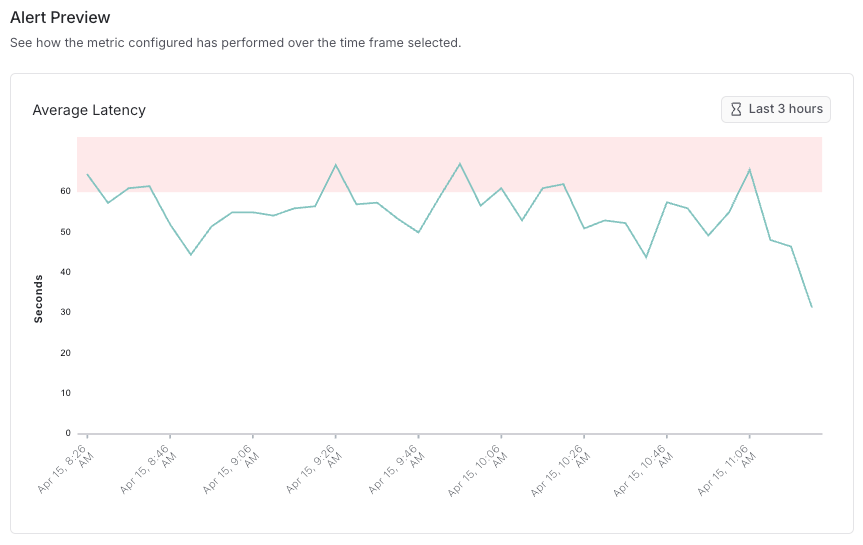
You can preview alert behavior over a historical time window to understand how many datapoints—and which ones—would have triggered an alert at a chosen threshold (indicated in red). For example, setting an average latency threshold of 60 seconds for a project lets you visualize potential alerts, as shown in the image below.
### Step 3: Configure notification channel
LangSmith supports the following notification channels:
1. [PagerDuty integration](/langsmith/alerts-pagerduty)
2. [Webhook notifications](/langsmith/alerts-webhook)
Select the appropriate channel to ensure notifications reach the responsible team members.
## Best practices
* Adjust sensitivity based on application criticality
* Start with broader thresholds and refine based on observed patterns
* Ensure alert routing reaches appropriate on-call personnel
***
[Edit this page on GitHub](https://github.com/langchain-ai/docs/edit/main/src/langsmith/alerts.mdx) or [file an issue](https://github.com/langchain-ai/docs/issues/new/choose).
[Connect these docs](/use-these-docs) to Claude, VSCode, and more via MCP for real-time answers.